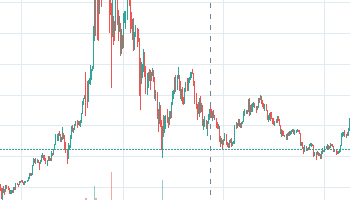
The ADX indicator is one of the most complicated indicators. Learning its use properly requires a perfect understanding of the indicator curve. Though Forex trading is very popular in Singapore, the number of successful traders is very low. Most of the traders are having trouble to protect their capital. Within a few months, they blow up the trading account and quit trading. But if you look at the professional traders, they don’t really struggle. They use the indicators in a smart way and execute the trades in favor of the trend. After reading this content, you will get a clear idea to use the ADX indicator like a pro trader.
The +DI and –DI line
The positive and negative DI line is a very useful tool in the ADX indicator. Sadly, the traders have a tough time, to understand its use. They use it to find the overbought and oversold state of the currency pairs and eventually lose money. But these curves are used to identify by the endpoint of the retracement and change in trend. For example, when the +DI line cross above the –DI line, you can expect a bullish rally. On the contrary, the bearish crossover represents the crossing of the + DI line below the – DI line. If you manage to understand this simple concept, you can expect to make some good trades in the bigger time frame.
The volatility curve
Understanding the market volatility with the help of the ADX indicator is really easy. The third curve or the grey color curve is the volatility curve. If the curve heads north, you can expect decent volatility. On the contrary, if the curve heads south, you should expect a low level of volatility. Knowing about the market volatility gives you a great advantage in options trading industry. It helps to make a quick decision and eventually you get the chance to make a decent profit from this market. But never rely on the volatility curve blindly. You have to rely on the news and other variables to predict the price movement. Once you get used to this technique, you can easily find the best trading time for any asset.
Developing a strategy
Now you should have a fair idea of the ADX indicator. So, how do we use this tool and make some money? To use the tool, we need to create a perfect trading strategy. Most of the time, the traders are able to make some huge progress with the help of a demo account. Create a simple strategy based on support and resistance level. Look for the bullish crossover when the price hits major support. On the contrary look for the bearish crossover the price test the critical resistance. With this simple concept, you can expect to make decent progress and become a successful trader.
Trading the reversal
Trading the reversal based on the ADX indicator is a little bit tricky. Most people want to trade the reversal when the volatility curve is at the peak. But the traditional bearish and bullish crossover is not going to work. You have to utilize the fundamental data to filter the potential reversal point. Major news like interest rate change, unemployment claim, etc. has the potential to change the trend. If you spot such major news, look at the indicator reading. If the data suggest the reversal is valid, place the trade with a 1% risk.
Learning to improvise
Learning to improvise your trading plan is the greatest skill of a trader. But this skill is not developed by reading books or traditional articles. You have to become an active trader to develop these skills. Thinking outside of the box and looking at the market from a different angle will always give you a significant advantage. You will know the potential risky trading zone and even after getting the right signal, you will not be placing any trade. But developing this skill takes time.


 Updated every 10 minutes


